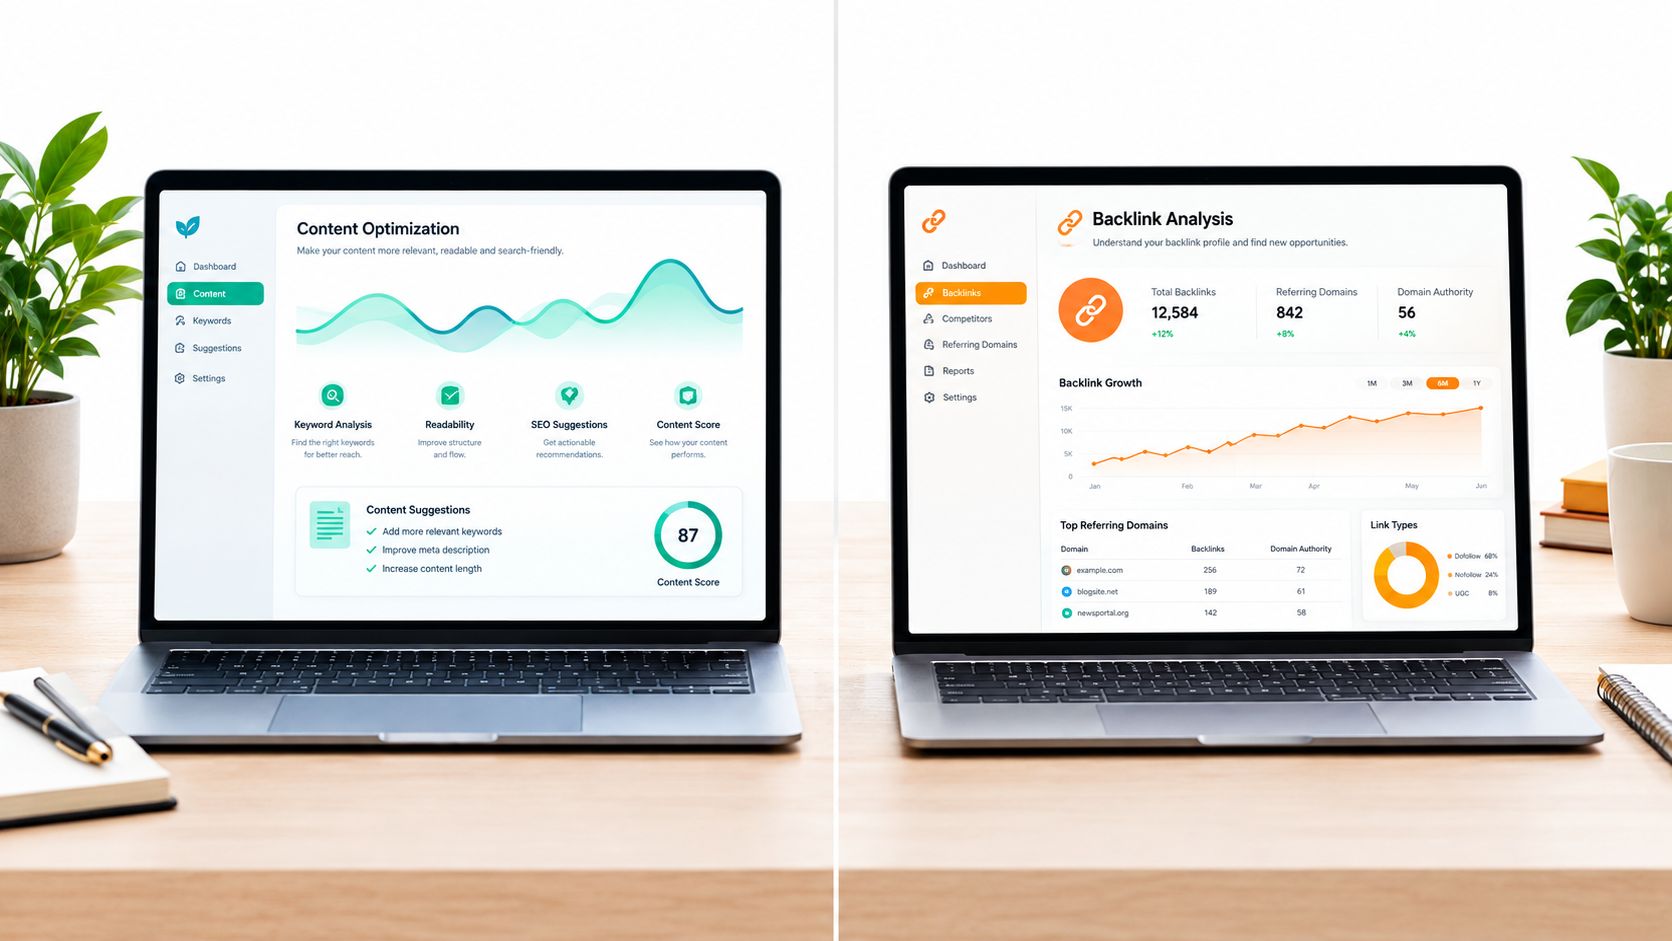
%20(1)-B86R08ZzwhPzS6UZbG3mSxRWPCwGwn.png)



Installing GA4 is not the same as monitoring web traffic. I've inherited enough dashboards at 2 a.m. to know that the attractive chart is often the least trustworthy part of the system. Traffic can rise while lead quality collapses, direct visits can absorb email and private sharing, and a clean acquisition report can exclude the people who declined consent.
Reliable monitoring starts with a harder question: which traffic should I trust, and what decision should it change? The practical answer combines first-party analytics, server logs, performance signals, consent diagnostics, attribution discipline, and external market context. Tools such as SemDash belong on top of that foundation, not in place of it.
Table of Contents
- Why Most Web Traffic Monitoring Quietly Fails
- Define What You Actually Need to Monitor
- Instrument Your Stack the Right Way
- Server Logs, Browser Tags, and ISP Data Compared
- Dashboards, Alerts, and UTM Standards That Survive Real Use
- Reading Trends and Cleaning Your Traffic Signal
- Maintenance Routine and Practitioner FAQ
Why Most Web Traffic Monitoring Quietly Fails
Web traffic monitoring is often treated as an installation task. Teams add a GA4 tag, open the acquisition report, and assume the dashboard represents reality. That assumption fails because the central problem is usually data trust, not missing charts.
Consent is one of the first cracks. Google Analytics 4 behavioral modeling has strict eligibility requirements. Consent mode must operate across all pages, the property must collect at least 1,000 events per day with analytics_storage='denied' for at least 7 days, and it must also have at least 1,000 daily users sending events with analytics_storage='granted' for at least 7 of the previous 28 days. Google documents these requirements in its GA4 behavioral modeling guidance. If the implementation misses them, the reports don't become less convenient. They can become incomplete in ways that distort trend interpretation.
The dashboard can be internally consistent and still wrong
Browser restrictions create another quiet failure. ITP, ad blockers, and cookie rejection weaken client-side identification, while private email and messaging links often arrive without a usable referrer. Those sessions can land in direct traffic, making a channel look stronger while hiding dark social and campaign influence. Affiliate fraud adds a different problem, because low-quality or incentivized visits can inflate acquisition without producing qualified demand.
I've also seen teams reinstall GA4 after adding bot-filtering logic and accidentally create duplicate client IDs or inconsistent event histories. The dashboard then shows a traffic increase that looks positive, while the lead-to-customer rate drops because the numerator and denominator no longer describe the same population.
Debugging rule: Before adding another report, prove that the existing numbers have stable definitions, coverage, and attribution.
Sampling and privacy thresholds compound the issue. Google explains that GA4 can hide report data when thresholds are applied to protect privacy, and its guidance recommends switching Reporting Identity to device-based when appropriate because the thresholds themselves can't be removed. A broad trend may look stable while the interesting tail, such as a small but valuable landing page group, disappears from view.
The fix isn't a larger dashboard. It's a trust layer that checks consent coverage, bot contamination, event continuity, attribution drift, and external context before anyone declares a win or loss. The rest of the workflow should answer three questions: what your first-party stack captured, what it missed, and whether an observed change reflects users, campaigns, technology, or the measurement itself.
Define What You Actually Need to Monitor
Traffic monitoring without a decision attached is vanity work. Before choosing a report, I write down the questions the business needs answered:
- Are we growing?
- Where is growth coming from?
- Which channels are profitable?
A B2B SaaS company might answer those questions badly with sessions, page views, and source rankings. Those metrics describe activity, but they don't necessarily explain whether the site is creating useful pipeline. A better design connects each business question to a metric hierarchy.
Build a metric pyramid
At the top sits the north-star business outcome. For a 50-person SaaS company, that might be pipeline-influenced conversion, not session count. If a surge of broad informational traffic produces no qualified opportunities, it shouldn't outrank a smaller stream of visitors who request a relevant demo and progress through sales qualification.
The middle layer contains channel KPIs. Organic search might use qualified demo requests and a branded versus non-branded search split. Paid media could use qualified pipeline by campaign. Referral partnerships might use assisted conversions, because the first visit may happen through a partner while the conversion occurs later through direct or branded search.
The bottom layer contains diagnostic sub-metrics. These help explain movement without pretending to be the outcome.
| Business Question | North-Star Metric | Channel KPI | Diagnostic Sub-Metrics |
|---|---|---|---|
| Are we growing? | Pipeline-influenced conversion | Qualified pipeline by channel | Users, sessions, engaged sessions, landing pages |
| Where is growth coming from? | New qualified opportunities | Source and campaign contribution | Referrer, UTM values, branded versus non-branded search |
| Which channels are profitable? | Pipeline or revenue influenced by channel | Cost-adjusted qualified conversions | Assisted conversions, funnel completion, lead quality |
Make every row earn its place
I don't put a metric on a dashboard because a platform makes it available. I ask what action follows if the number moves. If qualified-demo requests fall but sessions remain stable, I inspect landing-page intent, form behavior, traffic quality, and campaign mix. If non-branded search grows while pipeline stays flat, I review query intent and the pages receiving that traffic.
For this SaaS example, the monitoring charter might state: “We use traffic data to identify changes in qualified pipeline, diagnose channel quality, and locate funnel friction.” That sentence is more useful than a page full of unexplained cards.
Write that charter on one page before touching a tool. Define the business outcome, channel KPIs, diagnostic metrics, owners, reporting cadence, and the decision each alert should trigger. If a dashboard row can't tie back to a documented decision, remove it.
Instrument Your Stack the Right Way
I build instrumentation in layers, starting with the events that support decisions and only then adding analysis detail. A GA4 installation that fires one page view per page isn't enough for modern sites, especially single-page applications where route changes can occur without a full browser reload.
Start with deliberate event coverage
A typical implementation uses Google Tag Manager with a server-side container for governance and control, while the site data layer provides the event context. The event taxonomy should reflect real user actions:
- Product discovery: Track
view_item_listandselect_itemwith the list and item context needed for analysis. - Commercial intent: Track
begin_checkoutor the equivalent high-intent action, then connect it to downstream conversion records. - Content engagement: Use documented custom events for 75% scroll depth and CTA visibility when those signals answer a specific content or UX question.
- Conversions: Tag the critical conversion points, not every click that happens to be available.
I disable enhanced measurement when it creates ambiguous or duplicate events, then rebuild the required events deliberately. Each event needs a name, trigger, parameters, owner, and validation rule. In a single-page application, route changes must trigger the correct page and navigation events. If they don't, sessions, funnels, and landing-page reports can all undercount.
Google's consent-mode requirements also affect the order of operations. Tags must load before the consent dialog appears, and Google tags must load in all cases, not only after consent is granted, for the advanced implementation described in Google Tag Manager's consent-mode documentation.
Add logs and external context
All web servers generate access logs containing requests made to the server, so log analysis provides a direct traffic-monitoring path without relying only on browser analytics. I parse Apache or Nginx logs through a lightweight pipeline into a warehouse table, retaining request path, timestamp, response status, referrer, user agent, and bytes transferred. For QA, I can compare log patterns with GA4 client IDs using a hashed user-agent and IP time window. That join is for validation, not identity resolution.
For external context, I create a SemDash project, verify competitor domains, and map the relevant market set. Its traffic-share estimates complement first-party analytics as a directional sanity check, especially when GA4 volume drops across a category or competitor set. They shouldn't replace owned conversion data.
Cross-domain measurement, subdomains, and consent-mode v2 need testing as one journey. I also enforce a canonical UTM contract: lowercase values, a consistent source-medium-campaign hierarchy, no empty values, and a regulated-source allowlist. Campaigns don't launch until their URLs pass the validator.
Before publishing, I check debug_view, verify server-side events in real time, and inspect the dataLayer state on every critical template. A screenshot of a tag firing isn't proof that the parameters are correct.
Server Logs, Browser Tags, and ISP Data Compared
No measurement layer sees the whole web. The practical choice is to match the layer to the question, then triangulate when a decision matters.
Browser tags such as GA4, Plausible, and Matomo are strongest for consented user journeys, event sequences, and conversion paths. They lose visibility when users block scripts, reject consent, or receive a shortened cookie lifespan. Server logs are closer to the origin request and capture bots, failed requests, crawl paths, and status codes, but they can't tell you whether a request represented a meaningful human session. ISP and panel datasets provide market-level estimates, yet they can't connect competitor traffic to your form completion or revenue.
| Layer | What It Sees | What It Misses | Best Use Case |
|---|---|---|---|
| Browser tags | Consented sessions, events, funnels, conversion paths | Blocked scripts, rejected consent, some browser-restricted journeys | Conversion analysis |
| Server logs | Requests to the server, user agents, status codes, crawl and error patterns | Reliable human intent, complete funnel behavior | SEO crawl analysis and incident forensics |
| ISP or panel data | Directional market traffic, competitor visibility, share context | Your owned sessions, users, and funnel outcomes | Share-of-voice and market benchmarking |
Use each layer for its real job
I use GA4 to ask whether a landing page led to a qualified action. I use logs to investigate a crawler surge, a pattern of 404 responses, or a page that the browser report says nobody visited. I use panel estimates to understand whether a decline appears isolated to my domain or reflects a broader market movement.
That separation prevents a common mistake: treating an estimated competitor number as if it were an observed session count. Independent systems can diverge substantially, and research comparing Google Analytics values, third-party estimates, and log-based measures shows why first-party validation matters. The traffic estimation tools comparison from SemDash is useful for understanding that market-level estimates are directional rather than substitutes for owned analytics.
A production monitoring stack should triangulate browser data, server evidence, and market context. It shouldn't crown one source as universally correct.
Dashboards, Alerts, and UTM Standards That Survive Real Use
The dashboard I want a non-analyst to open on Monday morning is deliberately boring. One page should show sessions, conversions, engaged sessions, and a landing-page table. If the team needs five screens to understand whether qualified demand changed, the dashboard is hiding the decision rather than supporting it.
I add context only after the first page works. SemDash widgets can sit beside first-party numbers for competitor traffic share, branded versus non-branded trend, and referring-domain movement. Those views help explain search context, but they remain directional. A traffic-share estimate shouldn't override a CRM record or a validated conversion event.
For teams building a broader operational interface, the dashboard design guide by CloudCops GmbH offers useful examples of how to organize monitoring views without turning every available metric into a card.
Alert only when someone can act
An alert needs a threshold, a comparison window, an owner, and a response. I'd alert on a 40% drop in organic sessions over 7 days because that movement is large enough to justify checking indexing, deployment changes, search visibility, and tracking coverage. I wouldn't page someone for a 15% daily wobble, because normal weekday behavior, reporting latency, and attribution reassignment can create noise. Those thresholds are operating rules, not universal truths. I adjust them to the site's baseline and decision cost.
UTMs need the same discipline. My shared contract requires:
- Lowercase values: Keep
source,medium, andcampaignconsistent instead of creating separate buckets through capitalization. - Required hierarchy: Every campaign includes a defined source, medium, and campaign value.
- No blanks: Empty parameters create ambiguous rows that nobody can govern later.
- Allowlisted sources: Regulated or sensitive sources use approved values rather than free-text variations.
I publish the contract with a validator link and make campaign owners responsible for compliance. The SEO dashboard tools resource from SemDash can help teams place search monitoring alongside these first-party reporting views.
Reserve a weekly review window
The weekly ritual takes 30 minutes. I check the headline metrics, inspect the landing-page and channel changes, review alerts, and write one observation per dashboard. Each observation must include an interpretation and a next action, such as “organic qualified requests fell while non-branded sessions held steady, inspect form completion on the top landing pages.”
That written note prevents dashboard theater. A chart isn't a conclusion until someone explains what changed and what the team will do.
Reading Trends and Cleaning Your Traffic Signal
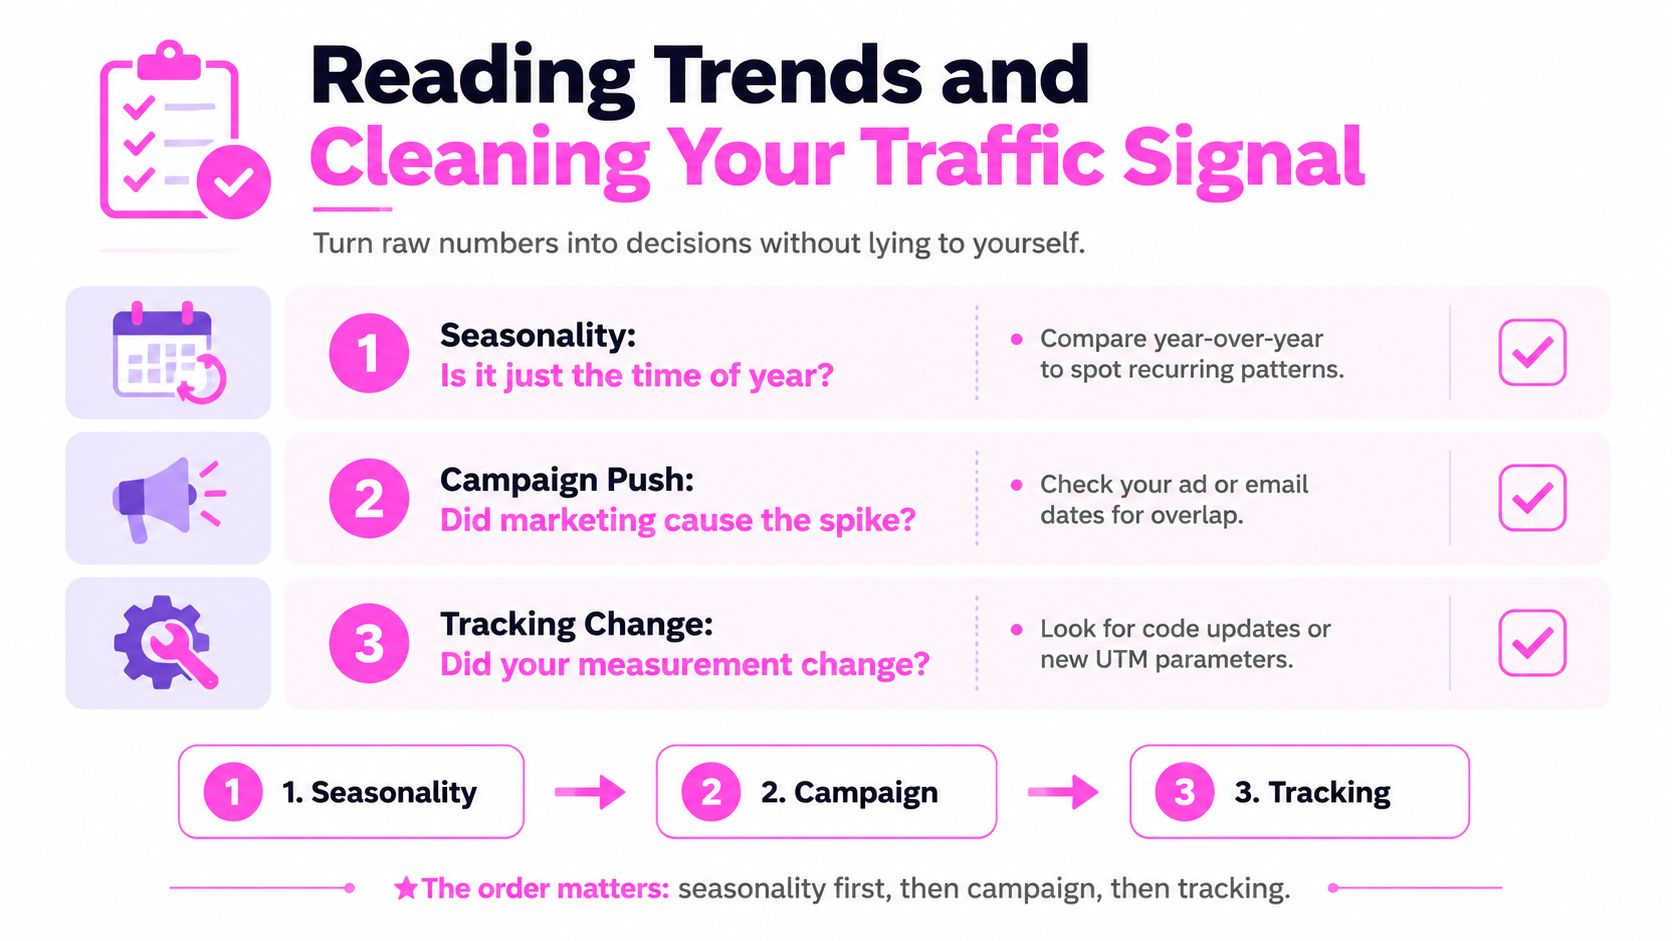
A traffic change becomes useful only after I separate its possible causes. I work through seasonality, campaign push, and tracking change, in that order. Starting with the code deployment is tempting, but it can waste hours if the apparent decline is a recurring calendar pattern.
Suppose organic sessions fall week over week. First, I compare the equivalent period for recurring behavior. Next, I check whether an email, paid campaign, partner placement, or product launch changed the mix. Only then do I inspect analytics releases, consent-banner edits, redirects, UTM changes, and tag deployments.
Filter bot noise without deleting real demand
I begin with the server evidence, not an arbitrary GA4 exclusion. I look for non-browser user agents, single-page sessions under one second, datacenter ASNs, repeated paths, abnormal request rates, and known headless fingerprints. A bot can execute JavaScript, so a browser report alone doesn't guarantee the session was human.
Once I identify a pattern, I exclude it using the narrowest possible rule and preserve a raw view for comparison. I don't remove every short session or unfamiliar user agent, because accessibility tools, privacy browsers, monitoring services, and legitimate buyers can share those characteristics. The goal is a clean decision view, not a sanitized number that conceals uncertainty.
Consent creates another baseline shift. If 60% of EU users reject cookies, GA4's observed population is incomplete, and modeled conversions can take over when the property meets the eligibility conditions documented in Google's modeling requirements. I annotate the date of any consent-banner change so leadership doesn't mistake a measurement shift for a demand collapse.
Treat sampling and thresholds as diagnostic signals
GA4 can apply thresholds to protect privacy, and large exploratory queries can also become difficult to interpret when the interface limits the available detail. When a report hides small segments, shows a warning, or changes after narrowing the date range, I export event data to BigQuery and query the underlying records instead of forcing the interface to answer a question it wasn't built to answer.
I also keep a change log for tags, consent settings, filters, redirects, and campaign naming. The log turns anomaly review from speculation into a sequence of checks. Every afternoon, you can apply the same filter: compare the period, check campaign overlap, inspect tracking changes, then validate suspicious traffic against logs.
The history of web measurement explains why this discipline matters. Server log analysis began in the early 1990s, commercial analytics emerged with WebTrends in 1993, and Analog was available by 1995, as documented in Contentsquare's history of web analytics. As sites became more complex, hit counts stopped representing useful behavior, and some large companies reportedly needed up to 24 hours to process logs by 1997, according to Priceonomics' account of early web analytics. More data has never automatically meant better decisions.
Maintenance Routine and Practitioner FAQ
Monitoring decays when nobody owns the maintenance. Each month, I reconcile GA4 totals with server-log patterns and SemDash estimates, audit UTM usage, review consent-banner behavior, refresh dashboard definitions, and document any new or changed events. Each quarter, I revisit the monitoring charter, remove unused metrics, test cross-domain journeys, and inspect whether channel definitions still match the sales process.
For infrastructure incidents, I also keep a separate performance workflow. Tools such as RETRO//STRESS stress-testing tools are useful when the question is whether latency or packet loss explains a traffic or conversion anomaly.
Five questions I hear after launch
Why do tools disagree? They measure different populations and events. Browser tools depend on consent and script execution, logs include bots and requests that never become sessions, and market estimates use external modeling.
How long should raw data stay available? Keep enough history to investigate seasonality, campaign changes, and tracking releases, while applying your legal, security, and storage policies. Preserve definitions and change logs even when raw retention expires.
Should I trust Semrush-style estimates? Use them directionally for competitor and market context. Validate any growth decision against first-party sessions, qualified conversions, and server evidence.
How do I defend the dashboard in leadership reviews? Show the definition, coverage caveat, comparison window, and action behind each headline metric. Confidence comes from transparent limitations, not false precision.
How does this fit SEO? Connect landing pages, query themes, rankings, clicks, crawl behavior, and qualified outcomes. You shouldn't rebuild the monitoring system each quarter. Update the event and decision layer as the program changes.
Use SemDash to compare competitor traffic share, ranking pages, keyword gaps, and search visibility beside your validated first-party data. Visit SemDash to add directional market context to your traffic-quality workflow, then use your own analytics, logs, and CRM outcomes to decide what deserves action.