

SEO Share of Voice for Teams: AI SOV + 30–50 Prompt Benchmark

SEO share of voice measures the percentage of total available organic search visibility your brand captures within a defined keyword set, calculated as your visibility score divided by the combined visibility of every competitor in that set, multiplied by 100. It works alongside a related metric, search visibility, and both matter for benchmarking against competitors instead of chasing individual rankings. In 2026, a complete SOV picture also has to account for how often AI engines cite your brand, not just where you rank on a results page.
TL;DR:
- SEO share of voice is most useful when tracked over time as a trend, rather than relying on a single precise number due to estimation limits.
- It is primarily driven by ranking positions, search volumes, and click-through rates, with tools providing estimates that require periodic validation against real data.
- Focusing on high-intent and transactional keywords yields a stronger correlation between SOV increases and actual revenue growth than broad awareness terms.
- Improvements in SOV are most effective when concentrated on specific content clusters rather than broad keyword sets, leading to measurable inbound leads in three to six months.
- Tracking AI share of voice requires repeated AI prompt testing across multiple platforms, with 30 to 50 runs per prompt to produce reliable citation rate estimates.
What Does SEO Share of Voice Actually Measure?
SEO share of voice is one piece of a bigger visibility puzzle. Marketers have long tracked share of voice across paid media (impression share in ad platforms), social (mentions and engagement), and earned PR (media mentions). SEO SOV applies the same logic to organic search: instead of counting ad impressions, you count estimated visibility across a defined set of keywords that matter to your business.
The reason SEO SOV usually gets priority over other channels comes down to intent. Someone searching “best project management software” or “how to file an LLC in Texas” is closer to a decision than someone scrolling past a sponsored post. Segmenting by buyer intent shows commercial and transactional queries correlate far more directly with pipeline than broad awareness terms do, which is why most SOV programs weight their keyword sets toward buying-stage language rather than top-of-funnel curiosity searches.
That said, SEO SOV has real limits, and stakeholders need to hear them upfront:
- Visibility scores are estimates, not verified traffic. Click-through rate curves vary by industry, device, and SERP feature layout.
- Keyword set selection biases the result. A narrow set inflates or deflates SOV depending on which terms you include.
- SERP volatility (algorithm updates, SERP feature changes) can move SOV independent of any real change in your content or authority.
- Cross-tool SOV numbers rarely match exactly, because each platform models visibility and CTR differently.
None of that makes SOV useless. It makes it a directional metric, best read as a trend line over months rather than a single precise number you report to the board as gospel.
How Do You Calculate SEO Share of Voice?
Two formulas cover almost every practical use case. The simpler one uses aggregate visibility scores; the more rigorous one weights each keyword by search volume and click-through rate at your actual ranking position.
Formula 1: Visibility-score SOV
SOV (%) = (Your visibility score ÷ Total visibility score across tracked competitors) × 100
Formula 2: CTR-weighted SOV
This is the version most analysts trust more, because it accounts for how much traffic a ranking position actually earns. The calculation weights each keyword by multiplying search volume by the expected CTR at your position, then sums that across your whole keyword set and divides by the same sum across every competitor.
SOV (%) = Σ (search volume × CTR at your position) for your domain ÷ Σ (search volume × CTR at position) across all tracked domains × 100
To run either formula, you need five inputs:
- A defined keyword list (ideally 50 to 500 buyer-relevant terms, not your entire index).
- Monthly search volume for each keyword.
- Your current ranking position for each keyword, plus competitor positions.
- A CTR-by-position curve (position 1 typically captures far more clicks than position 5, and AI Overviews or featured snippets shift that curve further).
- Visibility scores if you’re using Formula 1, pulled from a rank-tracking platform.
Statistic to anchor this: Backlinko’s SOV framework recommends SOV over single-keyword rank tracking specifically because it averages out daily ranking noise. A keyword bouncing between different positions looks alarming in isolation; inside an aggregated SOV score across a broad keyword set, such fluctuation has minimal effect.
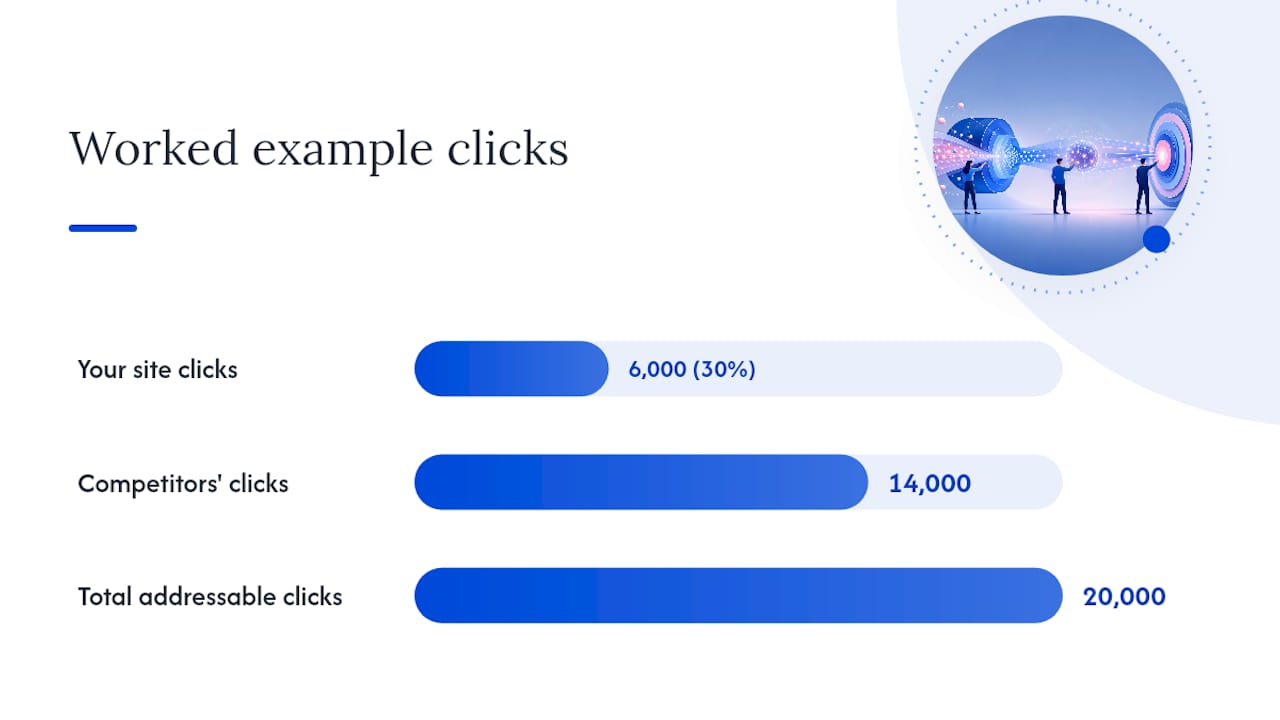
Worked example: Say you track 10 keywords with a combined 50,000 monthly searches. Your domain ranks well enough to capture an estimated 6,000 of those clicks after applying a CTR curve. Three competitors combined capture 14,000 clicks across the same keyword set. Total addressable clicks: 20,000.
Which Tools Give You Reliable SOV Data?
No single tool hands you a finished SOV number you can trust blindly. Building a defensible estimate means combining a few categories of data, each covering a gap the others leave open.
- Rank trackking platforms give you daily or weekly position data across your keyword set and competitors, the raw input for both SOV formulas.
- Visibility and traffic-estimate platforms convert positions into estimated clicks using CTR curves, letting you compare domains on a common scale instead of raw rankings.
- Google Search Console and analytics ground your estimates in real impressions and clicks for your own domain, the one dataset in your stack that isn’t modeled.
- API or bulk data exports let you pull competitor data at scale instead of checking keywords one by one, which matters once your tracked set passes a few hundred terms.
- Sampling constraints apply to every tool in this list: none of them index the entire web in real time, so treat every visibility score as an estimate with a margin of error, not a ledger entry.
A platform like Semdash’s competition analysis tool fits into the rank tracker and visibility layer, letting you pull competitor keyword overlap and estimated traffic share without stitching together three separate subscriptions. The tradeoff across every category is the same triangle: accuracy, coverage, and historical depth rarely max out together. A tool with deep historical SERP data may sample less frequently; a tool that checks rankings daily may not go back further than a few months.
Pro Tip: *Validate at least once a quarter by cross-referencing your tool’s estimated clicks against actual Search Console data for your own domain.
How Do You Measure AI Share of Voice?
AI share of voice tracks how often your brand gets cited inside AI-generated answers, across ChatGPT, Google’s AI Overviews, Perplexity, and similar engines, for a defined set of high-intent prompts. It’s the search-visibility equivalent of a mention, not a ranking, and it behaves differently enough from traditional SEO SOV that treating them as the same metric will mislead you.
The methodology has four steps:
- Build a prompt library. Mirror your keyword set, but phrase prompts the way people actually talk to AI engines: “best CRM for small teams” instead of “CRM software.” Prompts phrased as recommendations (“best X for Y”) tend to surface far more brand citations than purely definitional prompts like “what is a CRM,” so weight your library toward buyer-stage phrasing.
- Run each prompt repeatedly. A single run tells you almost nothing, because AI outputs vary between sessions. Reliable citation rates require running each prompt 30 to 50 times before you can trust the resulting percentage.
- Sample across multiple engines. Citation behavior differs by platform. A brand that dominates Google’s AI Overviews might barely register in ChatGPT, so aggregate across engines rather than reporting one platform’s number as your whole AI SOV.
- Normalize the citation rate. Divide the number of runs that cited your brand by total runs, per engine, then blend the engine-level rates into a single tracked score you can trend over time.
Statistic to anchor this: the 30 to 50 repeated runs per prompt benchmark exists because AI answers aren’t deterministic. Treat any AI SOV figure built on fewer runs as a rough guess, not a reportable metric.
Where AI SOV and SEO SOV diverge, that gap is itself useful data. A brand with strong organic SOV but near-zero AI citations likely has content that ranks but isn’t structured for extraction, missing the concise, quotable answer blocks that LLMs pull from. The reverse case, strong AI citations without matching organic rankings, often points to brand mentions from third-party sites (reviews, comparison articles) rather than your own domain. A resource on AI search visibility breaks down that gap in more detail if you’re seeing a mismatch. Either way, the fix is different depending on which side of the gap you’re on, which is exactly why tracking both numbers separately matters more than blending them into one score too early.

How Do You Turn SOV Data Into Action?
A SOV report that just sits in a dashboard is wasted work. The value shows up when you use it to prioritize where your team spends the next quarter.
Start by finding clusters where search intent is high but your SOV is low. That’s your opportunity list, ranked not by keyword difficulty but by how much traffic is actually walking past your brand toward someone else’s.
From there, the tactical playbook splits three ways:
- Content plays. Build flagship hub pages for your highest-volume clusters, then support them with concise, directly answerable Q&A sections. Short, extractable answers help both featured snippets and AI citation rates, since LLMs tend to pull the cleanest, most self-contained sentence rather than an entire paragraph of hedged prose.
- Technical fixes. Check for crawlability issues, thin internal linking to your priority pages, and slow load times on pages ranking just outside the top results, since those are often one technical fix away from a meaningful SOV gain.
- Link and PR plays. Earned mentions on third-party sites feed both traditional authority signals and AI citation frequency, since LLMs frequently cite aggregator and comparison content alongside brand-owned pages.
Paid amplification and PR pushes make sense when you need a short-term SOV spike, a product launch, a funding announcement, or a seasonal event, but they’re a supplement to organic growth, not a substitute. Measure the impact by tracking whether your organic SOV holds or climbs after the paid spend stops; if it drops right back down, the campaign bought attention without building durable visibility.
Pro Tip: When you find a high-volume, low-SOV cluster, check whether competitors are winning with a content format you haven’t tried, comparison tables, calculators, or video, before assuming you just need more words on the page.
What Should a Share of Voice Dashboard Include?
A dashboard built for stakeholders who don’t live in SEO tools every day needs to answer three questions fast: are we gaining or losing ground, where specifically, and how much should we trust the number.
The core dashboard should track:
- Overall SOV trend line across your full keyword set, updated monthly.
- SOV broken out by search intent (transactional, commercial, informational), since a rising average can hide a losing position on your highest-value terms.
- Competitor deltas, showing which specific competitors gained or lost share, not just an aggregate “market” figure.
- An AI SOV overlay, tracked separately but displayed alongside organic SOV so stakeholders see both channels without conflating them.
- A rough correlation line against pipeline or revenue, when your sales data supports it, since that’s what turns SOV from a vanity metric into a budget argument.
Update trend views monthly. Weekly checks make sense only for alerting on sudden drops, an algorithm update or a competitor’s aggressive content push, not for the strategic trend itself, which moves too slowly to warrant daily attention.
| Element | What it shows | Recommended cadence |
|---|---|---|
| Overall SOV trend | Aggregate visibility share over time | Monthly |
| SOV by intent | Buy vs. learn keyword performance | Monthly |
| Competitor deltas | Which named competitors gained or lost share | Monthly |
| AI SOV overlay | Citation rate across AI engines | Monthly, alert on major shifts |
| Alert triggers | Sudden ranking or visibility drops | Weekly |
Always present SOV with its estimation limits attached. A swing of a few percentage points month to month often falls within normal measurement noise rather than signaling a real shift, so frame small moves as “within expected range” rather than a win or a loss worth a full stakeholder briefing.
How Does SOV Compare to Market Share, Traffic Share, and Impression Share?
These four metrics get used interchangeably, which causes more confusion in stakeholder meetings than almost anything else in SEO reporting.
Market share is a business metric, revenue or unit sales relative to total category sales, and it’s usually the metric leadership actually cares about. SOV is a proxy for market share, not a replacement for it. A rising SOV that never shows up in revenue eventually needs an explanation.
Share of traffic measures actual visits your domain receives relative to competitors, pulled from real analytics rather than modeled visibility. It’s more accurate than SOV for your own domain, but you can’t measure a competitor’s actual traffic without third-party estimation tools, which reintroduces the same modeling uncertainty SOV already carries.
Share of impressions (native to Google Ads, called impression share) is the cleanest of the four, because ad platforms report it directly rather than requiring estimation. Organic SOV has no equivalent native metric; every organic visibility score is built from modeled CTR curves applied to observed rankings, which is precisely why it needs more caveats attached than its paid-media counterpart.
The practical takeaway: use SOV as a leading indicator you can act on weekly, and validate it periodically against traffic share and, where possible, market share data, so the metric stays anchored to something real.
What Happens When a Brand Improves Its SOV?
The clearest way to see SOV’s value is watching what happens when a brand systematically closes a visibility gap in a specific cluster rather than chasing individual keywords.
Rather than spreading effort across hundreds of keywords, the team concentrates on that comparison cluster: building out direct comparison pages, adding structured pricing tables, and earning a handful of third-party review mentions. Three to six months later, SOV in that cluster climbs into the 30s, and sales reports an increase in inbound leads mentioning the competitor by name, a strong signal the new content is influencing decisions during active evaluation, not just adding traffic.
A second common pattern shows up in AI SOV specifically. A brand with strong organic rankings restructures its top pages to include concise, self-contained answer blocks near the top of each page, rather than burying the answer under three paragraphs of preamble. Citation frequency in AI Overviews rises within weeks, because LLMs favor content built for extraction over content that requires interpretation to pull a clean answer.
Neither example requires a massive content budget. Both come from finding the specific cluster where the gap is largest and concentrating effort there instead of spreading it thin across an entire keyword universe.
Does SOV Actually Track With Business Performance?
SOV correlates with business outcomes most reliably when it’s segmented by buying intent rather than reported as one blended number. A brand can gain SOV on broad, informational queries, “what is project management,” for instance, without moving revenue at all, because that traffic sits too far from a purchase decision to matter much.
The stronger correlation shows up on transactional and comparison queries. When SOV rises on terms like “best [category] software” or “[competitor] alternative,” that shift tends to track closer to pipeline, because those searchers are actively comparing options, not researching a concept. Backlinko’s guidance on intent segmentation exists precisely because blending awareness-stage and decision-stage keywords into one SOV score hides which part of the funnel is actually driving results.
Timing matters too. SOV shifts usually lead revenue changes by weeks or months, not days, since it takes time for new visibility to translate into clicks, then into consideration, then into a signed deal. A quarter of rising SOV followed by flat revenue isn’t necessarily a failure. It might mean the sales cycle for your category runs longer than one reporting period, or that the SOV gains landed in a lower-intent segment of your keyword set.
The honest way to present this to leadership is as a leading indicator with a lag, not a same-quarter cause-and-effect metric. Track SOV and revenue on the same timeline, offset by your typical sales cycle length, and the correlation usually becomes visible even when a month-to-month comparison shows nothing.
Author Checklist: First 30/90-Day Priorities
Here’s what to actually do with this framework, broken into the first quarter.
Weeks 1 through 4: Build your buyer-intent keyword map, 50 to 200 terms segmented by funnel stage, and run a pilot SOV calculation against two or three named competitors using Formula 2. Don’t wait for a perfect keyword list; a rough first pass beats analysis paralysis.
Month 1 through 3: Build your AI prompt library from the same keyword map, run initial sampling, and launch two or three citable assets targeting your lowest-SOV, highest-volume cluster, comparison pages and structured answer blocks work well here.
90-day success criteria: a documented SOV baseline, an AI SOV baseline with at least 30 sampled runs per prompt, and one cluster showing measurable SOV movement you can point to in a stakeholder update.
— Leonid
Put This SOV Framework to Work With Semdash
Semdash is built for exactly the workflow this article just walked through. Instead of stitching together a rank tracker, a separate AI citation checker, and a spreadsheet to run the math yourself, Semdash’s competition analysis tool pulls competitor visibility and keyword gaps into one place, and the AI Overview checker tracks how often your domain gets cited in AI-generated answers.
If you want to see where your SOV baseline actually stands before committing to a subscription, start with the free SEO tools to check visibility on a handful of priority keywords, or pull a competitor’s keyword footprint using the keyword research tool. Once you’re ready to build the full pilot SOV calculation from this guide, running the AI Overview checker against your comparison-page prompts is the fastest way to see whether your content is getting cited or getting skipped.
Sources
For readers who want to go deeper into the calculation methods and AI SOV frameworks referenced throughout this guide:
- How to Calculate Share of Voice (+ Why it Matters for SEO) — Backlinko
- Share of Voice: Definition + How to Measure and Grow It in 2025 — Talkwalker
- Share of Voice in Marketing: The Complete Guide (Including AI Search) - RankScope
FAQ
What Is a Good Share of Voice Percentage?
There’s no universal benchmark, since it depends on how many competitors you’re tracking and how concentrated the market is.
What Does 100% Share of Voice Mean?
In practice this is rare outside a narrow branded keyword set, since most commercial keyword clusters have multiple domains competing for visibility.
What Is the Difference Between Share of Search and Share of Voice?
Share of search specifically measures your brand’s search volume relative to category-wide search volume, essentially how often people search for you by name versus your competitors. Share of voice is broader, covering estimated visibility, mentions, or citations across organic, paid, social, and now AI channels, not just branded search demand.
What Does “Share of Voice” Mean?
Share of voice measures the percentage of total available visibility, attention, or mentions a brand captures relative to its competitors within a defined channel and keyword or topic set. In SEO specifically, it’s calculated as your visibility score divided by total tracked visibility, multiplied by 100.