


You open last month's deck and share of voice is up eight points. The stakeholder wants a reason before the call. You open the export and the competitor list gained a small publisher, mobile got mixed into the desktop file, and a dozen keywords were swapped for "cleaner" ones. The market didn't move. The frame did.
That's the failure I see most often when people ask how to measure share of voice. I freeze the competitive set, the device, and the keyword universe before I trust a single percentage. Most reported swings come from a changed input, not from buyers.
Table of Contents
- The Share of Voice Formula and Which Version to Use
- How to Calculate Share of Voice from Ranking Data
- Setting Timeframes, Channels and Keyword Segments
- Visualizing SOV Trends Without Misleading Charts
- Measuring AI Answer Share of Voice Reliably
- Diagnosing Why Share of Voice Suddenly Moved
- Confirm Your Denominator This Week and Set Up the Report
The Share of Voice Formula and Which Version to Use
Share of voice is your brand's visibility divided by total visibility for the whole tracked competitive set, multiplied by 100. BrandMentions' share of voice guidance states that ratio as SOV = brand visibility / total competitive-set visibility × 100, and it only holds when every domain uses the same keywords, weights, geography, and time window.
A raw ranking count loses the commercial difference. Position 1 on a 40,000-search term is not the same asset as position 1 on a 300-search term. Weights, whether monthly volume or estimated impressions, keep that difference in the numerator. A fixed denominator keeps the percentage from drifting just because the category grows.
The mention form is the same math. If the set produces 10,000 relevant mentions and your brand has 2,000, you have 20% SOV. Going International's measurement notes use that split, and they flag the usual failure: swapping competitors or keywords between periods makes the percentage move when the conversation has not.
The denominator is the brands you chose to track. It is not sales market share, and it is not "everyone who could possibly rank."
| Metric | Formula | Data source | Use it for |
|---|---|---|---|
| Organic visibility SOV | brand weighted visibility / total set visibility × 100 | rank tracking with CTR or impression weights | organic search trend |
| Paid SOV | brand ad impressions / total set ad impressions × 100 | ad platform impression reports | paid auction share |
| Mention SOV | brand mentions / total set mentions × 100 | news, social and forum monitoring | earned conversation share |
| Share of search | brand searches / comparable brand searches × 100 | keyword volume or Google Trends index | demand signal |
| AI answer SOV | answers citing brand / answers citing any set brand × 100 | repeated prompt panel across engines | AI answer presence |
Practical rule: Pick the row that matches the decision in front of you. I would never compare a number from one row with a number from another and call the gap a trend.
How to Calculate Share of Voice from Ranking Data
This is the run I execute for organic visibility. I map the flow first, then I don't skip a box because a dashboard already shows a percentage.
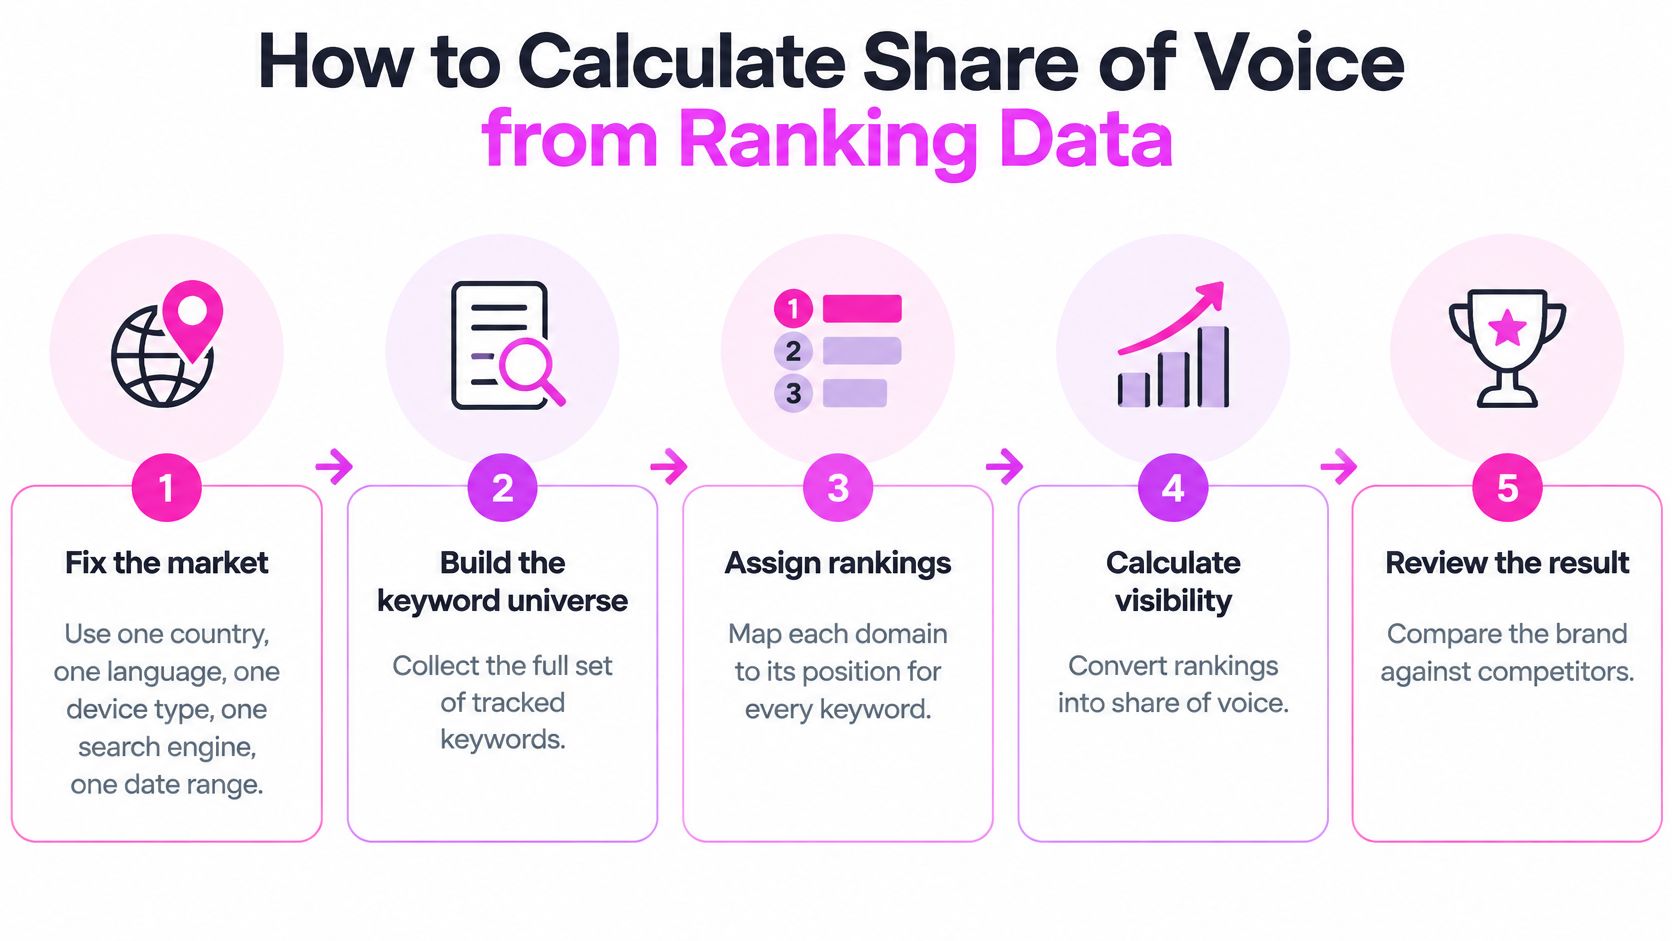
- Fix the market. One country, one language, one device type, one search engine, one date range. Mixing desktop and mobile in one file changes who "wins" without anyone publishing a page.
- Build the keyword universe. I pull 150 to 300 category terms from seed lists, People Also Ask, and a competitor keyword gap, then I drop irrelevant and duplicate queries. A stable list is what makes month two comparable with month one.
- Weight every keyword. Monthly search volume or estimated impressions. Unweighted presence is a side report, not the score.
- Record the ranking URL and position for every brand in the set, and count each URL once. Duplicate URLs inflate a domain that syndicates the same page.
- Convert position to visibility with a CTR curve or with observed impressions. Equal points per rank is how a position 9 informational URL masquerades as a position 2 commercial one.
- Sum, divide, multiply by 100. Say your brand holds 1,200 visibility points and the set holds 6,000. That's 20%. Write the numerator and the denominator next to the percentage.
- Report four views, not one. Unweighted ranking presence, weighted SOV, branded versus non-branded SOV, and page-level ownership. A domain can gain rankings and still lose the commercial queries.
Keep the competitor set honest
The set has to be brands that compete for the same consumer need. Deep Marketing's share of search write-up treats that choice as the measurement decision: adjacent products dilute every share, and a Google Trends index is not sales. Trends comparisons cover up to five terms at a time, so a larger set has to be chained through one reference brand and aggregated the same way every month. I use that index for direction only. Market share is sales. This number is exposure.
Before I publish a change, I recalculate last month on this month's competitor list. If the old result doesn't reproduce, the "movement" is the denominator.
Setting Timeframes, Channels and Keyword Segments
A weekly line on a 200-keyword set is mostly noise. I use a monthly window for the trend, and a two to four week window on either side of a launch when the question is campaign impact. Quarterly is enough for branded demand, which moves slower than rankings.
| Question | Window | Keyword or item set | Compare against |
|---|---|---|---|
| Did a campaign move visibility? | 2-4 weeks before and after | Campaign keywords plus category set | Same weeks in the previous period |
| Is organic visibility trending? | Monthly | Full tracked keyword universe | Trailing three-month average |
| Which channel is gaining? | Monthly | Per-channel keyword or source set | Same competitor set in the prior month |
| Is brand demand growing? | Quarterly | Branded terms for every brand in the set | Same quarter of the prior year |
I split the work in three directions, and I don't blend them back together.
Channel. Organic, paid, earned media, and AI answers stay in separate files. A paid impression and an organic impression are different exposures.
Intent. Branded, commercial, and informational terms get their own SOV. Owning "brand plus pricing" is a different business result from owning a definition query.
Market. A national rollup hides the city you sell in. Picture a retailer at 35% nationally and 8% in the one city where the stores are. The national figure would send budget the wrong way.
Earned media needs a code, not a dump
For mentions I follow a coded sample, the way Fullintel's media KPI guide lays it out. Define the category, competitors, markets, languages, channels, and window before you pull anything. Retrieve the items, deduplicate syndicated copies, and drop homonyms, spam, and bot reposts. Classify brand mention, competitor mention, sentiment, prominence, and estimated reach. Mention SOV is relevant brand mentions divided by total relevant mentions in the set, times 100.
I report reach-weighted SOV beside the raw share. Ten small posts are not one national article. Two trained coders label a validation sample, and I check agreement with Cohen's kappa before anyone scales the set. Low agreement gets fixed first. I don't read mention share as sales. Crises, launches, duplicated wires, and uneven audiences all move the count. On a small sample I want a confidence interval, and I keep the query rules so last quarter can be rebuilt.
Lock the window and the segment definitions in writing before the first run. If they aren't written down, the next analyst will "improve" them and break the series.
Visualizing SOV Trends Without Misleading Charts
A stakeholder can read four lines. They can't read a blended index that hides a mix shift.
I plot the brand and its top three competitors over 12 months, weekly or monthly, with a rolling four-week average so one volatile SERP doesn't look like a strategy change. I mark algorithm updates, launches, and campaigns on the date they happened. A spike without a mark is a data question, not a win.
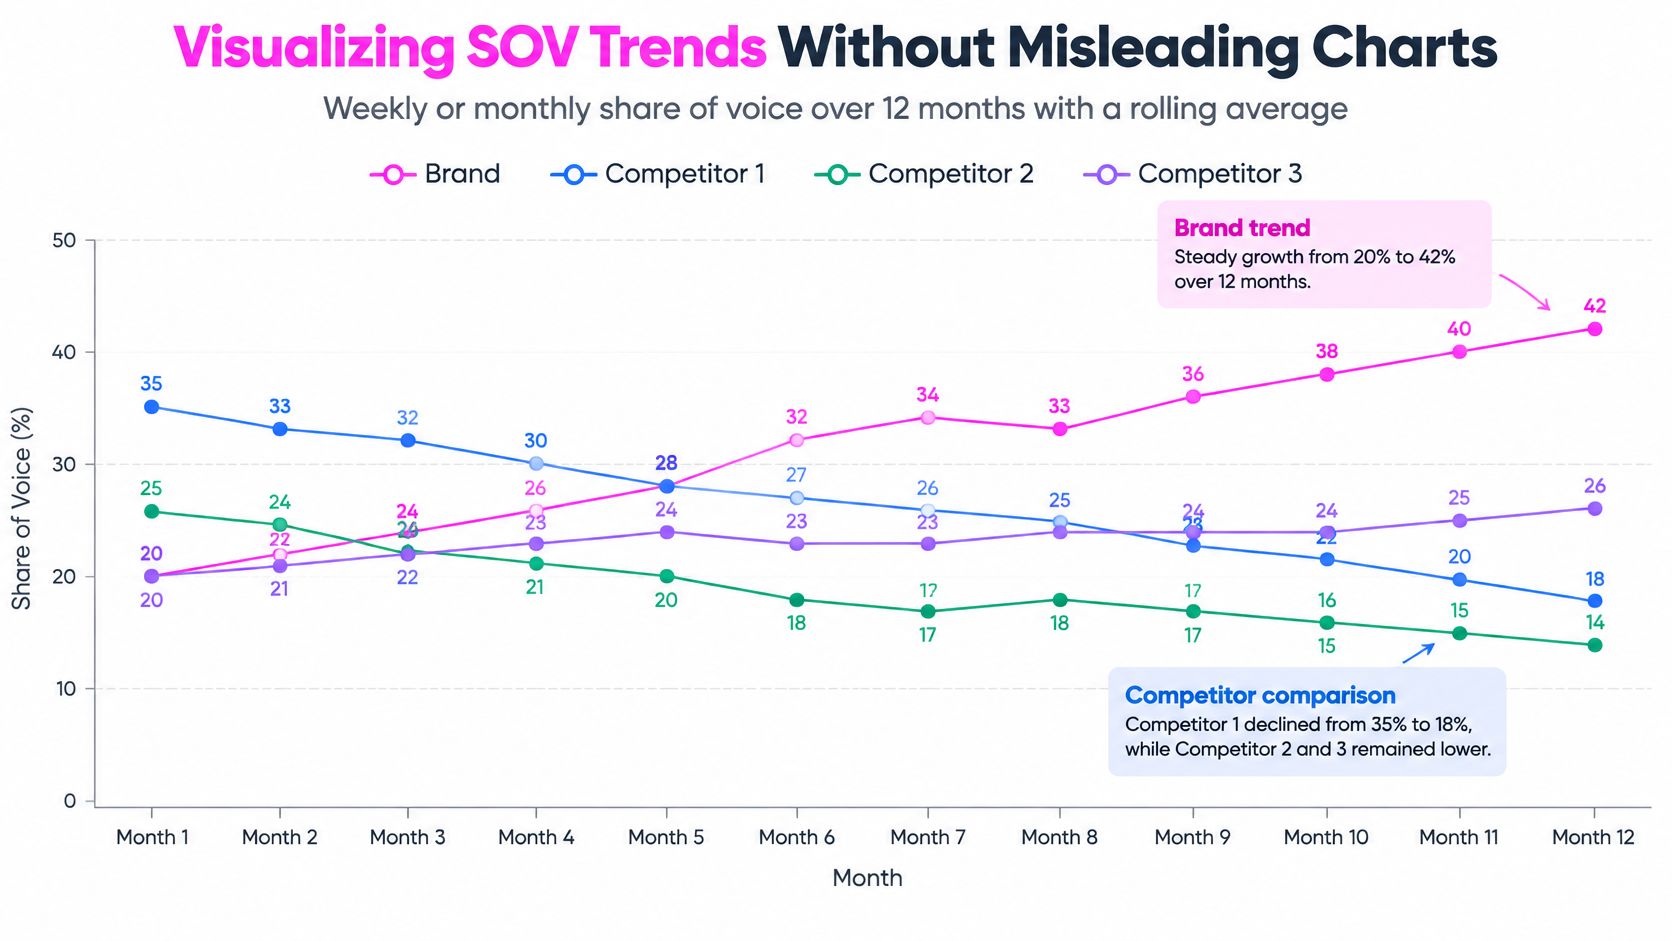
Split the chart into panels: organic, paid, and branded versus non-branded. One blended line hides the mix. Say organic SOV falls four points while paid SOV rises six, and the single line shows a modest gain. The meeting celebrates. What happened is you bought the points you lost in the unpaid results.
Shopify's share of search guide is blunt about the scale problem. Organic SOV is your search impressions divided by total search impressions for the tracked set, times 100. Paid SOV uses ad impressions on that same set. A 30% share on 1,000 impressions is not comparable with 30% on one million. I print the numerator and the denominator under the line, and I keep market, device, search type, date range, and competitor list on the chart. Otherwise the file compares your organic impressions with someone else's paid ones.
Pair ranking SOV with estimated traffic share. If SOV falls while traffic share holds, you may have traded broad informational queries for fewer, higher-intent pages. I treat that as stronger business visibility, not a loss, and I say so on the slide. For the traffic-share side of that comparison I use the same framing I describe in our note on organic search visibility.
Before the chart leaves my desk I check five labels: date range, competitor set, sample size, denominator, and whether the figures are weighted or unweighted. A missing label is how a good series gets misread.
Measuring AI Answer Share of Voice Reliably
A single prompt, run once, is not a measurement. It's a coin flip you then put in a quarterly review.
Overads' AI share of voice tracking makes the instability concrete. In a 2026 sample of 968 successful prompt-engine runs, 42.9% of prompt-engine pairs switched between mentioning and not mentioning the tracked brand at least once. Two consecutive runs had a median overlap of only 41% in cited domains. A one-time test confuses model variability with a real visibility change.
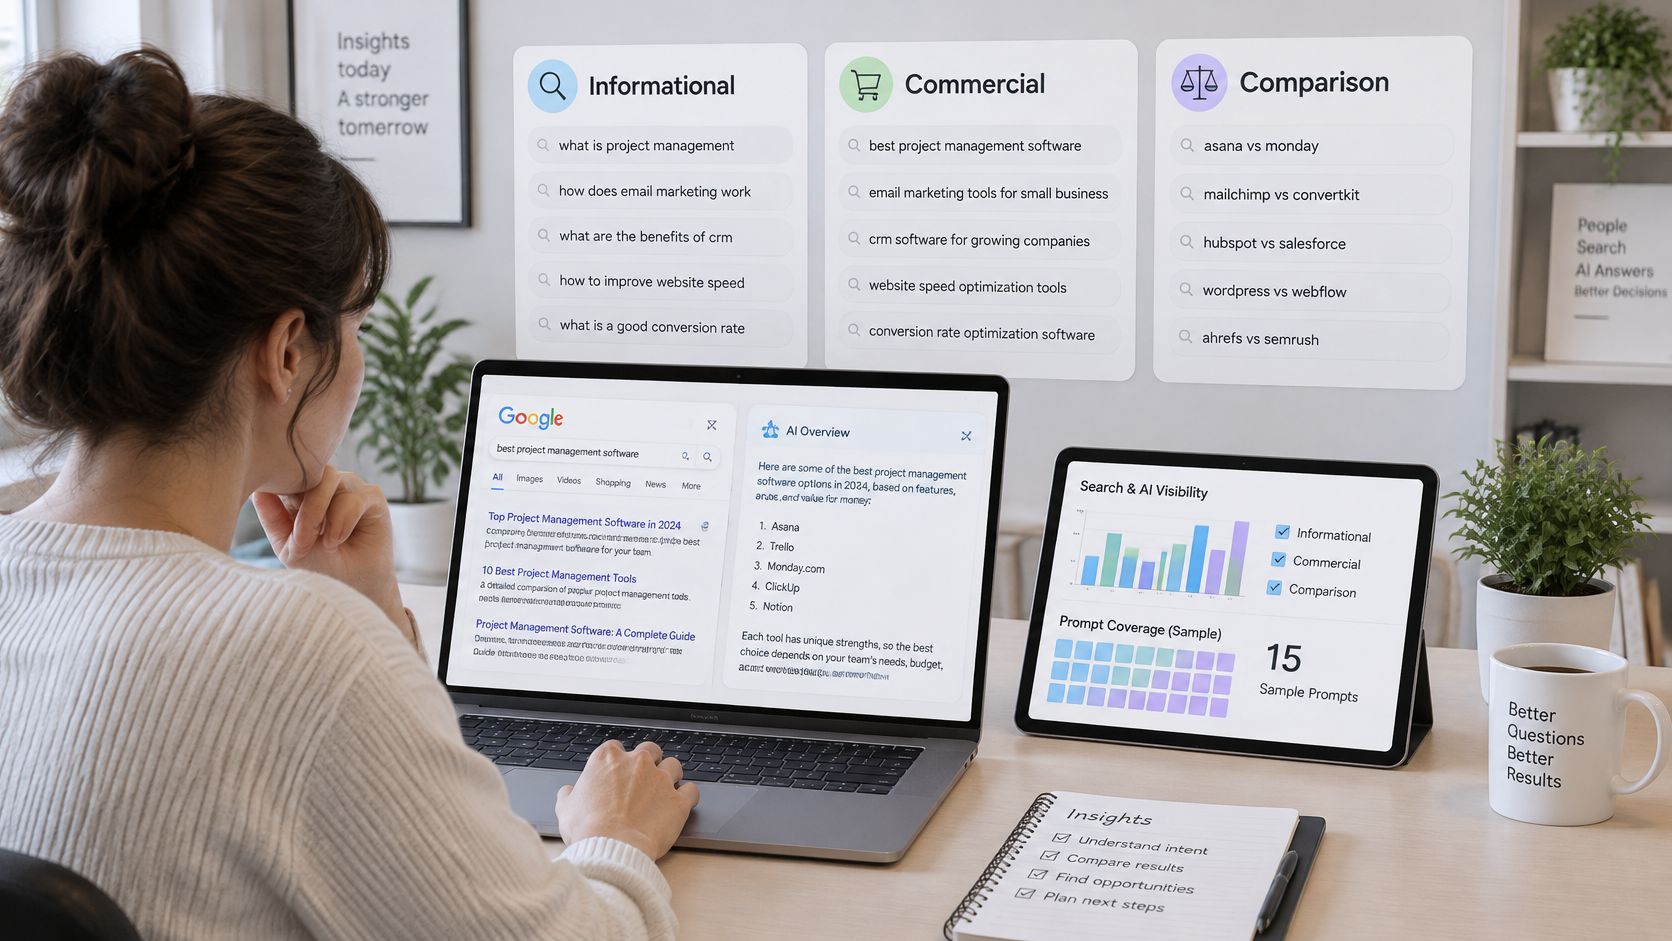
The metric only means something against a defined prompt set, engines, market, language, competitor list, and run frequency. I build a stratified panel of unbranded, buyer-language prompts across informational, commercial, and comparison intent, sized to the category. Each prompt gets repeated runs, on each engine, in each location I care about.
I do not collapse that into one percentage. I report four numbers:
- Mention rate: how often the brand name appears in the answer.
- Citation rate: how often a source is attached to that mention.
- Cited-URL share: which of our pages, if any, earns the citation.
- Volatility: how often the same prompt flips between runs.
Aliases and false matches get a manual pass before anything is counted. A product name that is also an ordinary English word will inflate you overnight.
Keep this file apart from organic rankings. One answer can name several brands, and the cited sources are rarely independent, so the percentages don't behave like a search SOV that sums toward 100. Citation tracking is the useful extra: which URL earned the mention, and whether that same page ranks in Google or Bing. I walk through that URL check in our guide on how to track AI Overviews.
An API response is not automatically what a person sees in the consumer app. I treat every run as a sample. I call a change real only when it survives a repeat run on the same panel.
Diagnosing Why Share of Voice Suddenly Moved
I don't brief a swing until I've checked the frame. Competitor set, keyword list, device mix, date range. In my experience the overnight jump is one of those four, and a changed competitor set is the most common.
| Symptom | Likely cause | Check or fix |
|---|---|---|
| SOV jumps 10+ points overnight | Competitor added to or dropped from the set | Freeze the competitor list and recalculate the old period |
| Rankings rise but SOV falls | High-volume keywords lost to a competitor page | Compare weighted SOV keyword by keyword, not average position |
| Desktop and mobile numbers disagree | Device mix differs between periods | Report each device separately |
| Same URL counted several times | Duplicate or syndicated pages | Deduplicate by URL before summing |
| Mention SOV rises, sales flat | Owned posts or bot activity counted | Exclude owned posts and check reach-weighted SOV |
| Share of search up, SOV flat | Branded search and exposure measure different things | Report each metric on its own |
What you can fix today, and what waits
An afternoon is enough for the first four rows. Freeze the list, rerun the prior period, split devices, and dedupe URLs. If the jump disappears, you don't have a market story. You have a file story.
Mention inflation and a share-of-search divergence need the monthly review, because they aren't calculation bugs. Owned posts make earned conversation look stronger without independent demand. Branded search can rise while exposure on category terms stays flat, and both numbers can be correct.
Set a noise floor before you react. Rerun the same frozen frame on unchanged data. If two recalculations of the same month differ by 1.5 points, a 2-point move is too small to call. Only a move that survives a recalculation on the frozen competitor list gets a sentence in the report.
Confirm Your Denominator This Week and Set Up the Report
Don't start with a new tool. Start with a list you can't edit.
Day one. Pick one market, one device, and three to five direct competitors. Write the names down.
Day two. Build 150 to 300 category terms and weight each by monthly search volume. Our Traffic Share view shows the top 100 websites with the most organic traffic from those seed keywords, and we show the specific page Google sends traffic to for every keyword, so the ranking URL doesn't have to be collected by hand. The same steps work with any source that returns a URL and a position.
Day three. Calculate SOV for the last 90 days as the baseline. Then recalculate the first of those months on the final competitor list. If it doesn't reproduce, the denominator isn't locked yet.
Week two. Set the monthly cadence and build one trend chart with the five labels: date range, competitor set, sample size, denominator, weighted or not.
Lock the denominator this week. Every later comparison depends on it.
SemDash pulls keyword, URL, and SERP history into one workspace so you can weight a fixed keyword set and see which page earns the visibility. If you're ready to stop arguing with a moving competitor list, start with a free trial or book a demo at SemDash.