


Most SEO reports I inherit lead with rankings and domain authority, then bury the revenue question at the end. That stack tells you the site moved. It doesn't tell you whether search brought people who buy. I rebuilt the reporting stack around ten search engine optimization metrics, and each one answers a specific business question. Read alone, every one of them misleads.
A rank without the URL, the query, and a conversion is a vanity average. A domain score without traffic is a vendor number, not a Google signal. In 2024, roughly 360 clicks per 1,000 U.S. Google searches went to the open web, according to Search Engine Land's write-up of SparkToro's clickstream analysis. If most searches never become a visit, a rank chart can't be the report.
I don't start with a long selection ritual. I open organic sessions next to conversion rate, then impressions and clicks, ranking distribution, CTR by query type, visibility and traffic share, keyword difficulty, referring-domain net growth, authority scores, index coverage, and AI Overview citations. Each metric below is judged by what it fails to tell you, and by the partner I won't ship a report without.
Table of Contents
- 1. Organic Sessions and Organic Conversion Rate
- 2. Impressions and Clicks from Search Console
- 3. Average Position and Ranking Distribution
- 4. Click-Through Rate by Position and Query Type
- 5. Organic Visibility and Traffic Share
- 6. Keyword Difficulty and Opportunity Score
- 7. Referring Domains: New, Lost, and Net Growth
- 8. Domain Authority Scores: DR, DA, and Trust Flow
- 9. Indexed Pages and Crawl Coverage
- 10. AI Overview Citation Visibility
- How the 10 search engine optimization metrics compare at a glance
- Pick Five Metrics and Stop Checking the Rest
1. Organic Sessions and Organic Conversion Rate
Organic sessions count visits from unpaid search. On their own they tell you almost nothing. Traffic can rise from seasonality, a brand push, or one glossary page while the pages that sell stay flat.
I always pair sessions with organic conversion rate, conversions divided by organic sessions, and with the revenue or lead value those conversions generate. When sessions climb and conversion rate drops, you're often ranking for informational queries that don't match what the business sells. That's the first check in any audit I run, because it's the question leadership asks.
On a B2B software site I audited, organic sessions doubled over a year and demo requests stayed flat. Segmenting by landing page showed the new traffic was a glossary of definitions. We pushed commercial pages up in internal linking, and demo requests rose within two quarters.
An e-commerce size guide had strong sessions and a conversion rate near zero. I didn't try to rank it for buying queries. We added product filters and links into category pages, and it became a path to purchase.
Practical rule: Sort a landing-page report by revenue, with sessions and conversion rate beside it, and don't scale a page that sits under your minimum conversion threshold.
Connect Search Console to analytics so queries join on-site behavior. I use a domain keyword view to see which commercial terms competitors get that we don't.

2. Impressions and Clicks from Search Console
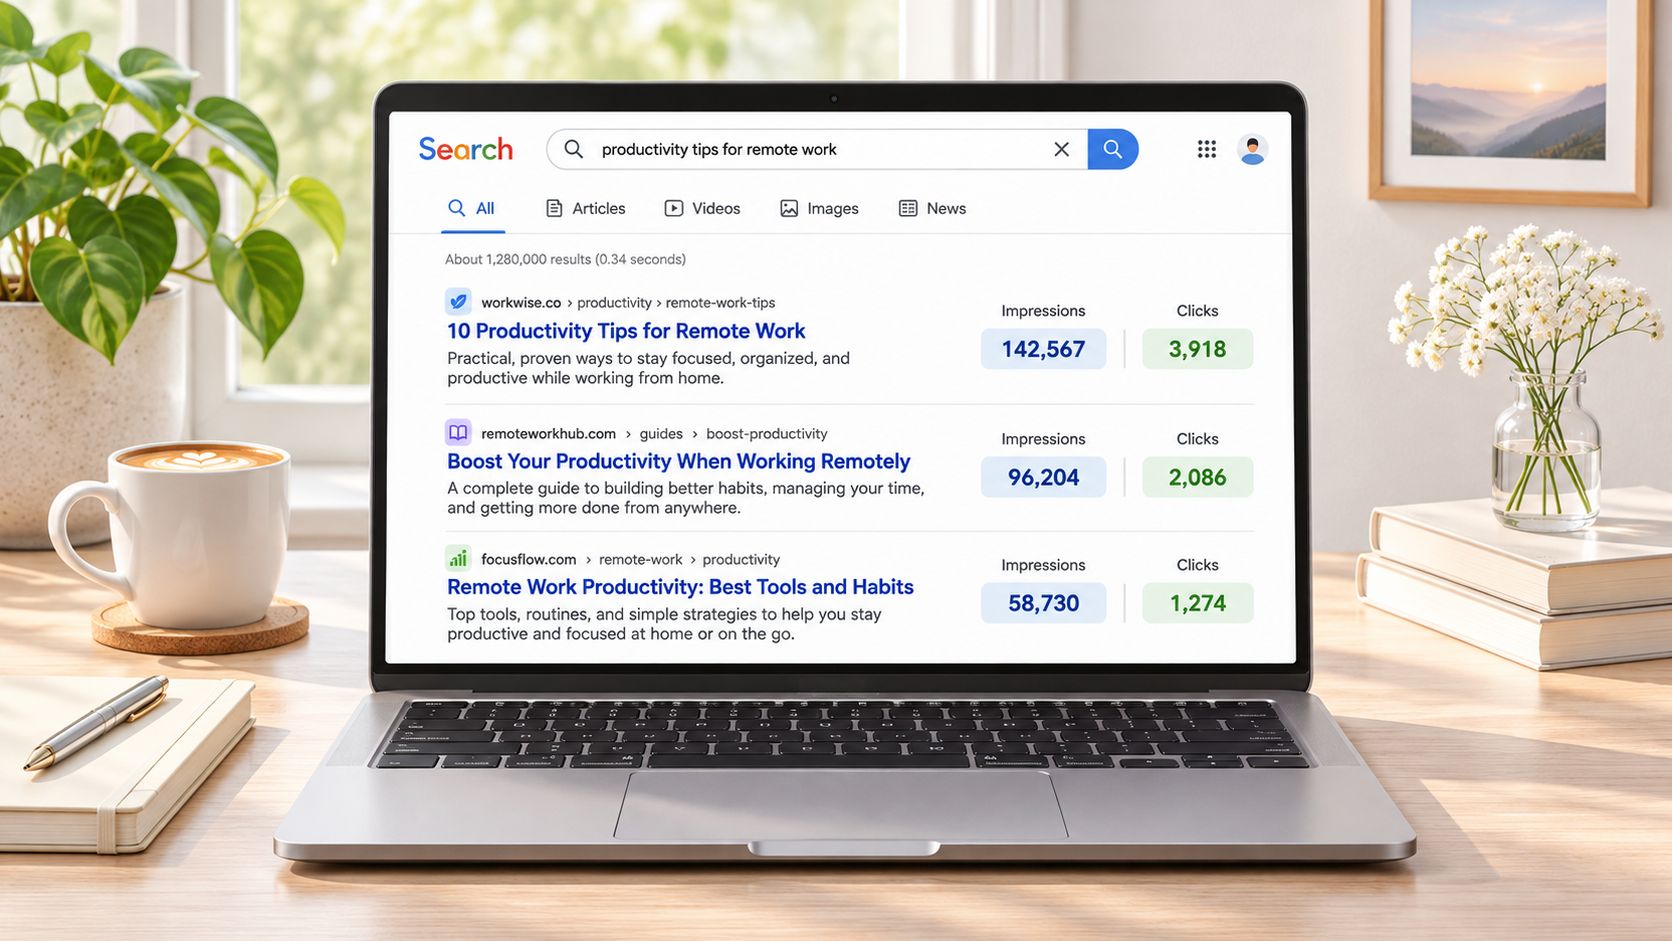
Google's Search Console help treats impressions, clicks, CTR, and average position as one system. An impression is a time your link was shown. A click is a selection of that link. One thousand impressions and 50 clicks is a 5% CTR. Impressions show exposure. Clicks show whether anyone chose you.
I read them together. High impressions and almost no clicks usually mean a title, snippet, or intent problem, not a ranking problem. Impressions also surface page-two and page-three queries you never targeted. Those are often the cheapest content wins on the account.
I found a product page with 40,000 monthly impressions for a query it didn't target, and only 300 clicks. The title was generic. The query wanted a comparison. Rewriting the title around that comparison lifted clicks within a month, with no rank change.
Another content site had dozens of queries sitting in positions 11 to 20 with real impression volume. A dedicated section plus internal links moved a cluster onto page one. That beat writing new articles.
Property-level reporting can count several URLs from one site as a single impression, while page-level reporting counts each URL. If you ignore that, cannibalization looks like a traffic drop.
Before I rewrite a title, I sort Performance by impressions, filter weak CTR, tag queries by intent, and check whether one URL is stealing the query from another. SERP history tells me if an impression drop is a Google layout change or our own rank loss.
3. Average Position and Ranking Distribution
Average position is easy to celebrate and easy to misuse. Search Console averages the topmost result from your site for each impression. It isn't a stable rank for one page. A site result at position 2 and another at position 8 can report as 5, and that 5 hides the URLs, devices, and layouts behind it.
I don't trust the mean. I want a ranking distribution: how many tracked keywords sit in positions 1 to 3, 4 to 10, 11 to 20, and beyond 20. That shows whether you're close to a breakthrough or stuck in the middle. A rank tracker is sharper than the Search Console average, but it only covers keywords you chose. Read both.
A client's average moved from 14 to 9 and the team cheered. The gain was one keyword jumping from 80 to 9. Core commercial terms stayed between 12 and 18. Once the buckets were visible, we put effort on the 11 to 20 group, and that's where the next visible gains came from.
On a local services site, Search Console looked strong in the target city because nearby suburbs inflated impressions. Exact positions in the service area were on page two. The fix was location pages, not more blog posts.
Keep a fixed commercial keyword set per market and report the buckets monthly. Prioritize positions 8 to 20. Don't compare averages across periods if the keyword set changed. A 12-month SERP history shows whether a move is persistent or a short spike.

4. Click-Through Rate by Position and Query Type
CTR is clicks divided by impressions. It tells you whether the listing earns the click once it appears. It does not tell you whether the SERP even had room for a click.
Google's CTR documentation is clear that property-level aggregation can show a higher CTR and a better average position than page-level reporting, because the property counts only the topmost position while it consolidates impressions. One blended site CTR is not a benchmark. I compare CTR at the query-and-URL level, then split brand from non-brand, country, device, and position band.
A position 3 result under a featured snippet, a local pack, or an AI answer can earn far fewer clicks than position 3 on a clean SERP. I compare each page with an expected CTR for its position and query type. Well below expected means snippet or intent. At or above expected, with weak traffic, means you need rank, not a new title.
A recipe site ranked well and still lagged peers on CTR. Titles named the dish and skipped time or dietary fit. We changed titles on a group of similar pages and left a control group alone. The test set moved.
For a SaaS comparison query, CTR fell after a featured snippet landed above the results. Chasing the old title wouldn't help. We added a comparison table and a short definition so the page could earn the snippet.
Check the live SERP before you rewrite a snippet. A missing feature explains a lot of "bad CTR."
5. Organic Visibility and Traffic Share
A clean rank report can still hide a losing category. Organic visibility estimates the share of search demand a domain captures across a fixed keyword set, usually weighted by volume and position. Traffic share is the competitive cousin: your slice of estimated organic traffic versus named competitors. Pair them. Visibility alone cannot tell you whether rivals took the commercial queries.
The metric fails when the keyword list changes underneath it. A rising score can be terms you added to the set, not ground you won. I lock a topic cluster or product category for at least two quarters before I judge a trend. Organic search visibility only means something if that universe stays still.
Visibility gains from glossary terms can mask flat traffic share. Strengthen commercial and category pages rather than publishing more blog content.
In a 2025 survey of 350 North American marketing professionals, organic search generated an average of 33% of website traffic across seven industries in 2024, and 91% said SEO positively affected performance, according to Conductor's State of Organic Marketing. High-maturity teams measure far more indicators than low-maturity teams. I still won't track the whole market. I compare three to five named competitors, and I split visibility by commercial, informational, and navigational intent so a glossary win can't hide a commercial loss.
6. Keyword Difficulty and Opportunity Score
Keyword difficulty is a tool estimate of how hard the current top results are to beat, usually from the authority of the pages and domains already there. It isn't a promise, and it isn't a business case. A high-volume term at KD 70 can be the wrong first bet for a new site. A KD 25 term with buying intent and a near-miss rank can be the best return you'll get all quarter.
I build a rough opportunity score from difficulty, volume, current position, and SERP intent. The score earns its keep when it tells me what not to write.
A small consultancy chased a KD 60 head term for six months and didn't break through. A KD 30 term with lower volume and a clear buying intent hit page one within a quarter and produced more qualified leads. The difficulty number had been right. My read of business value was the mistake.
An agency cut 2,000 keywords to 150 with a KD filter, then reviewed the top 50 SERPs by hand. About a third of that shortlist died in review, because the top results were forums and marketplaces a new brand couldn't displace.
Check the SERP first. Difficulty is a starting filter, not the decision.
Set thresholds from your own history, not from a universal KD number you saw in a slide.
Refresh scores quarterly. Competitor links move them.
Cluster related queries so one page covers a group instead of one term at a time.
7. Referring Domains: New, Lost, and Net Growth
Stanford's early PageRank notes modeled the web as a link graph. Links from stronger pages carried more weight than links from obscure ones. That history is why I don't report raw backlink totals. Referring domains count unique sites that link to you, no matter how many links each site sends. Ten relevant domains usually tell me more than hundreds of links from one domain.
The view I trust is net growth: new referring domains minus lost ones, monthly, tied to a campaign or a launch. Losses matter as much as gains. Redesigns, missing redirects, and expired domains eat authority. A rising count of directories and scraped sites can make the profile look healthier than it is.
A B2B firm celebrated 300 new referring domains in a quarter. Most came from one thin guest-post network. We disavowed that network and put the effort into three research pieces that earned about 40 editorial links. Traffic to those pieces grew. The raw count fell, and that was the correct outcome.
An e-commerce brand lost 15 percent of its referring domains after a migration that changed URLs without redirects. Mapping the lost links and restoring redirects, plus a short outreach pass, recovered most of the equity within two months.
Report new and lost separately. Review the top 50 new domains by relevance and traffic, not by count. After every migration or CMS change, look for lost links before you buy new ones. Gap analysis against domains that already link to competitors is a better outreach list than a cold directory.
8. Domain Authority Scores: DR, DA, and Trust Flow
Domain Rating, Domain Authority, and Trust Flow estimate link strength on a normalized scale. They're useful for comparing you with competitors and for watching whether a link program is changing the profile. They aren't Google metrics, and none of them ranks you.
The failure mode I see most is treating a DA jump as success when organic traffic and conversions didn't move. If the score rises and rankings don't, the new links probably aren't reaching the pages that sell.
A publisher's DA moved from 38 to 46 after a paid link program. Organic traffic didn't move for two quarters. The links sat on low-relevance pages with little crawl activity. We stopped the program and chased editorial links. Traffic followed. The score rose more slowly, which I was fine with.
A B2C brand sat about 10 DR points behind four competitors. The gap wasn't high-authority directories. It was industry publications. That changed the outreach list overnight.
Use the score to pick who you're losing to. Don't set an absolute DA target and call the quarter won.
Track the score next to organic traffic and ranking distribution. Ignore movement on domains with almost no organic traffic, because those scores twitch without a business effect. When a score jumps, open the individual referring domains behind it before you brief the team.
9. Indexed Pages and Crawl Coverage
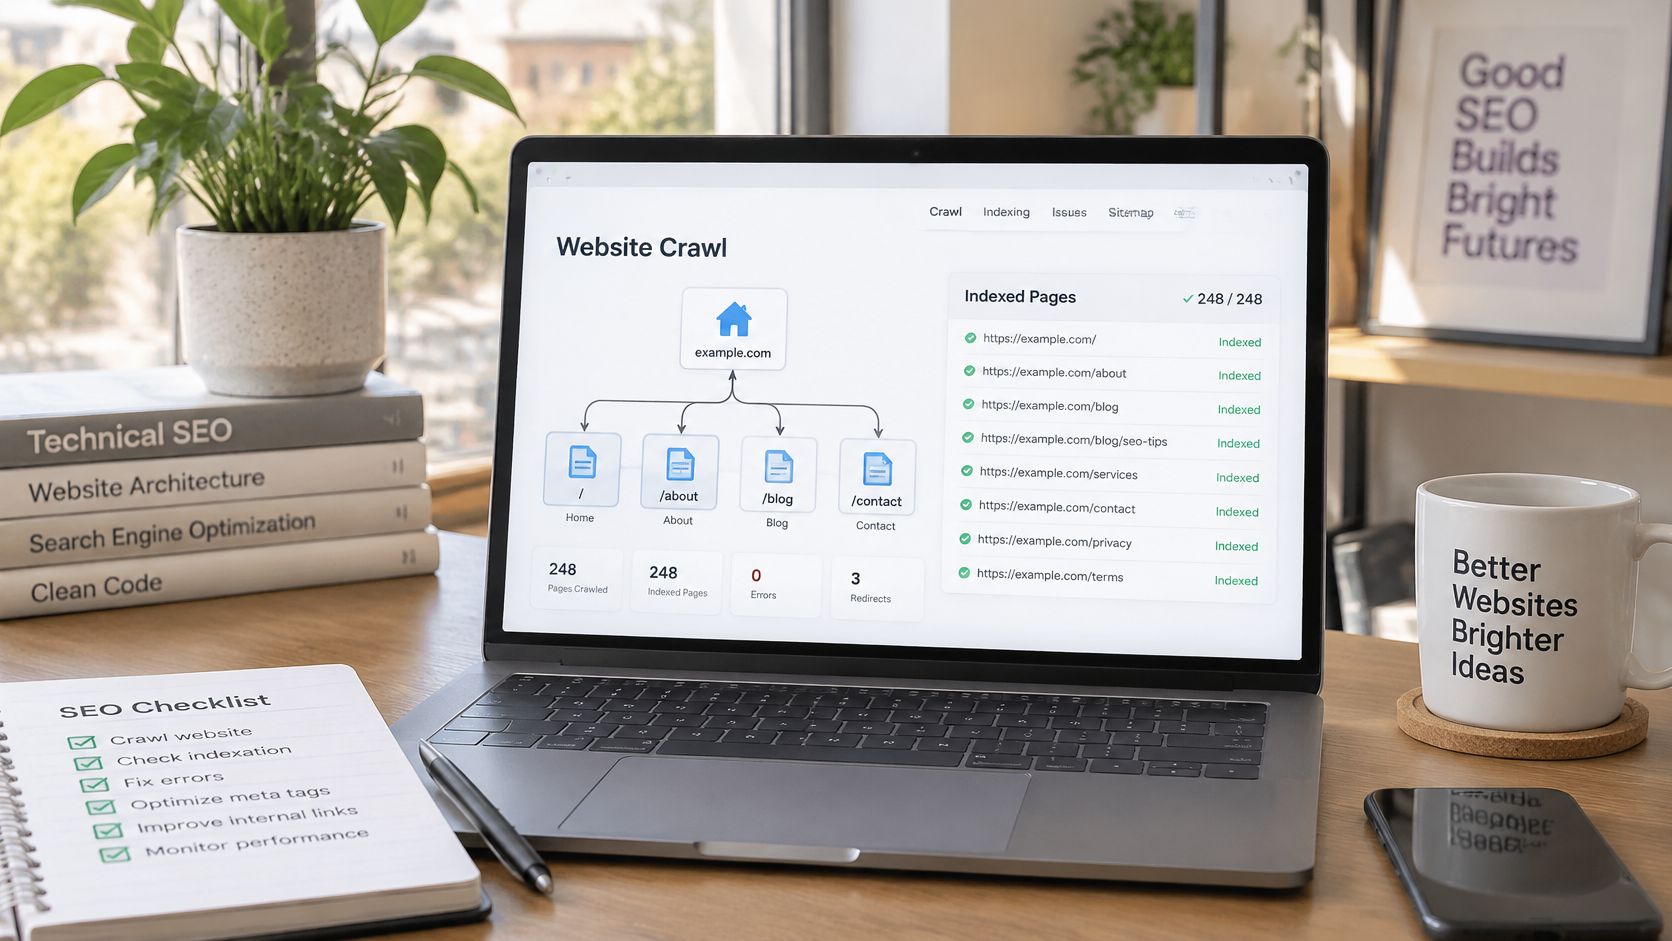
A page Google hasn't indexed can't rank, no matter how clean the copy is. Indexed pages are the URLs in the index. Crawl coverage shows where Googlebot is spending its time. I check both before content or link work, because technical blockers waste the rest of the stack.
The useful comparison is indexed URLs against the URLs you intend to rank. Say you have 4,000 product pages and 1,800 are indexed. That gap is the work list. Crawl stats add the reason. Budget spent on parameter URLs, faceted filters, or redirect chains is budget not spent on the pages you care about.
A marketplace with millions of URLs was feeding crawl budget to filtered category pages. Blocking low-value parameter combinations and tightening canonicals cut the waste, and new product pages started getting indexed faster each week.
A content section showed as crawled but not indexed. The pages were thin near-duplicates. Merging them into distinct pages cleared the status within a few weeks, and the consolidated URLs started ranking for longer-tail queries.
What I check before I brief writers
Indexed versus intended. Compare the counts every month, not only after a traffic scare.
Exclusion reasons. Look for a pattern in Search Console, not a single angry total.
Response codes and server time. Slow or broken responses shrink how much Google fetches.
Keyword-to-URL mapping. Confirm the page you want indexed is the page currently ranking.
10. AI Overview Citation Visibility
A citation in an AI Overview can look like a win while the click never arrives. Ahrefs' update on AI Overviews reports that the average CTR for the top-ranking page on queries showing an AI Overview fell sharply between December 2023 and December 2025. Rank still matters. It no longer tells you whether the answer is using your page or a competitor's.
Citation visibility fails as a single score. It does not show whether the cited URL is the page you want, whether the mention replaced the visit, or which source Google chose. Pair it with organic clicks on the same queries. Rising citations beside falling clicks mean the overview is absorbing demand. A citation on the wrong URL means the ranking page and the trusted page have split.
I recommend three lists, not one blended KPI: cited, absent, and cited on the wrong URL.
A health publisher appeared on symptom queries, but the cited URLs were older pages with outdated guidance. Updating those pages and consolidating duplicates moved the citations onto the revised URLs.
A SaaS site was missing from how-to queries where competitors were cited. Those competitors had clearer steps and structured data. Matching that structure changed the citation pattern within a few months.
Check overview presence monthly on your top 100 informational queries. Record the cited URL, not just the domain.
Set those citations next to organic clicks on the same queries. That comparison shows whether the mention is supporting the visit or standing in for it. For the query list and the exact cited URLs in one place, how to track AI Overviews is the workflow I recommend.
How the 10 search engine optimization metrics compare at a glance
| Metric | What It Measures | Primary Source | Review Cadence | Main Blind Spot |
|---|---|---|---|---|
| Organic Sessions and Organic Conversion Rate | Unpaid search visits, conversion rate, and resulting revenue or lead value | Google Analytics 4 or another analytics platform; Search Console for query context | Review trends over at least 90 days | Attribution errors, seasonality, and low-value traffic can distort results |
| Impressions and Clicks from Search Console | How often pages appear in Google results and how often users click them | Google Search Console | Review regularly; export query data monthly | Covers Google only, and anonymized queries or SERP features can distort counts |
| Average Position and Ranking Distribution | Average search ranking and the spread of keywords across position ranges | Google Search Console and rank trackers | Rank trackers daily or weekly; review distribution monthly | Averages hide variation across queries, locations, and devices |
| Click-Through Rate by Position and Query Type | Clicks relative to impressions, segmented by ranking and query type | Google Search Console | Monitor regularly; allow weeks to assess snippet tests | SERP features, query mix, and low-volume data can skew CTR |
| Organic Visibility and Traffic Share | Estimated share of search demand or organic traffic captured versus competitors | SEO visibility and competitor-analysis tools | Track across quarters using a stable keyword set | Estimates depend on the keyword list and tool methodology |
| Keyword Difficulty and Opportunity Score | Estimated ranking difficulty and relative priority of keyword targets | Third-party SEO tools, supported by SERP analysis | Refresh difficulty scores quarterly | Scores are estimates and may miss relevance, content quality, or SERP realities |
| Referring Domains: New, Lost, and Net Growth | Unique linking domains gained or lost over time | Search Console and backlink research tools | Review monthly | Counts do not show link quality, and tool indexes are incomplete |
| Domain Authority Scores: DR, DA, and Trust Flow | Vendor estimates of link-profile strength for comparison and trend tracking | Moz, Ahrefs, and Majestic | Review when vendor data updates; compare with performance trends | Not Google ranking metrics; scores vary by vendor and can be gamed |
| Indexed Pages and Crawl Coverage | URLs included in Google's index and how Google crawls the site | Google Search Console | Review monthly and after major site changes | Indexing does not guarantee rankings; some exclusions are intentional |
| AI Overview Citation Visibility | Whether and which site pages are cited in AI Overviews for tracked queries | Google AI Overview results and visibility-tracking tools | Check tracked queries monthly and monitor ongoing changes | Measurement is evolving, citations fluctuate, and citations may not drive traffic |
Pick Five Metrics and Stop Checking the Rest
A dashboard with ten metrics gets skimmed. A dashboard with five gets acted on. My starting set is organic conversion rate, non-brand clicks, the ranking distribution for commercial terms, referring-domain net growth, and indexed pages against intended URLs.
I review that set monthly. Every movement needs a page-level explanation before I add a sixth chart. Conversion rate without the landing page hides a glossary surge. Non-brand clicks without query intent hide a title problem. Distribution without a fixed keyword list hides a changed tracker. Net referring domains without a quality pass hides a guest-post network. Index counts without the intended URL list hide crawl waste.
That's the trade-off I accept. You will miss a vanity spike. You will also stop rewriting titles when the underlying issue is query targeting, and you will stop buying links when the commercial pages aren't indexed.
High-maturity teams already measure more indicators than everyone else. More indicators only help if someone owns the action. I add AI citation tracking when informational queries are a real acquisition path, and I add visibility or traffic share when a named competitor is the actual fight. I don't add them because the tool has a tab.
If you want a structured starting point, SemDash's SEO Academy has video tutorials on the workflows above, and the community is a practical place to check your interpretations with other SEO professionals. For a hands-on walkthrough of how these metrics connect in one workspace, you can book one of SemDash's free live calls with an SEO specialist.
SemDash pulls keyword, backlink, and SERP data into one workspace so you can pair rankings with the exact URL, competitor traffic share, and AI Overview citations instead of reading each number alone. You can start with keyword gaps, referring domains, and 12-month SERP history before you add another chart to the monthly report. Visit SemDash and map the five metrics above to the pages that earn the business.